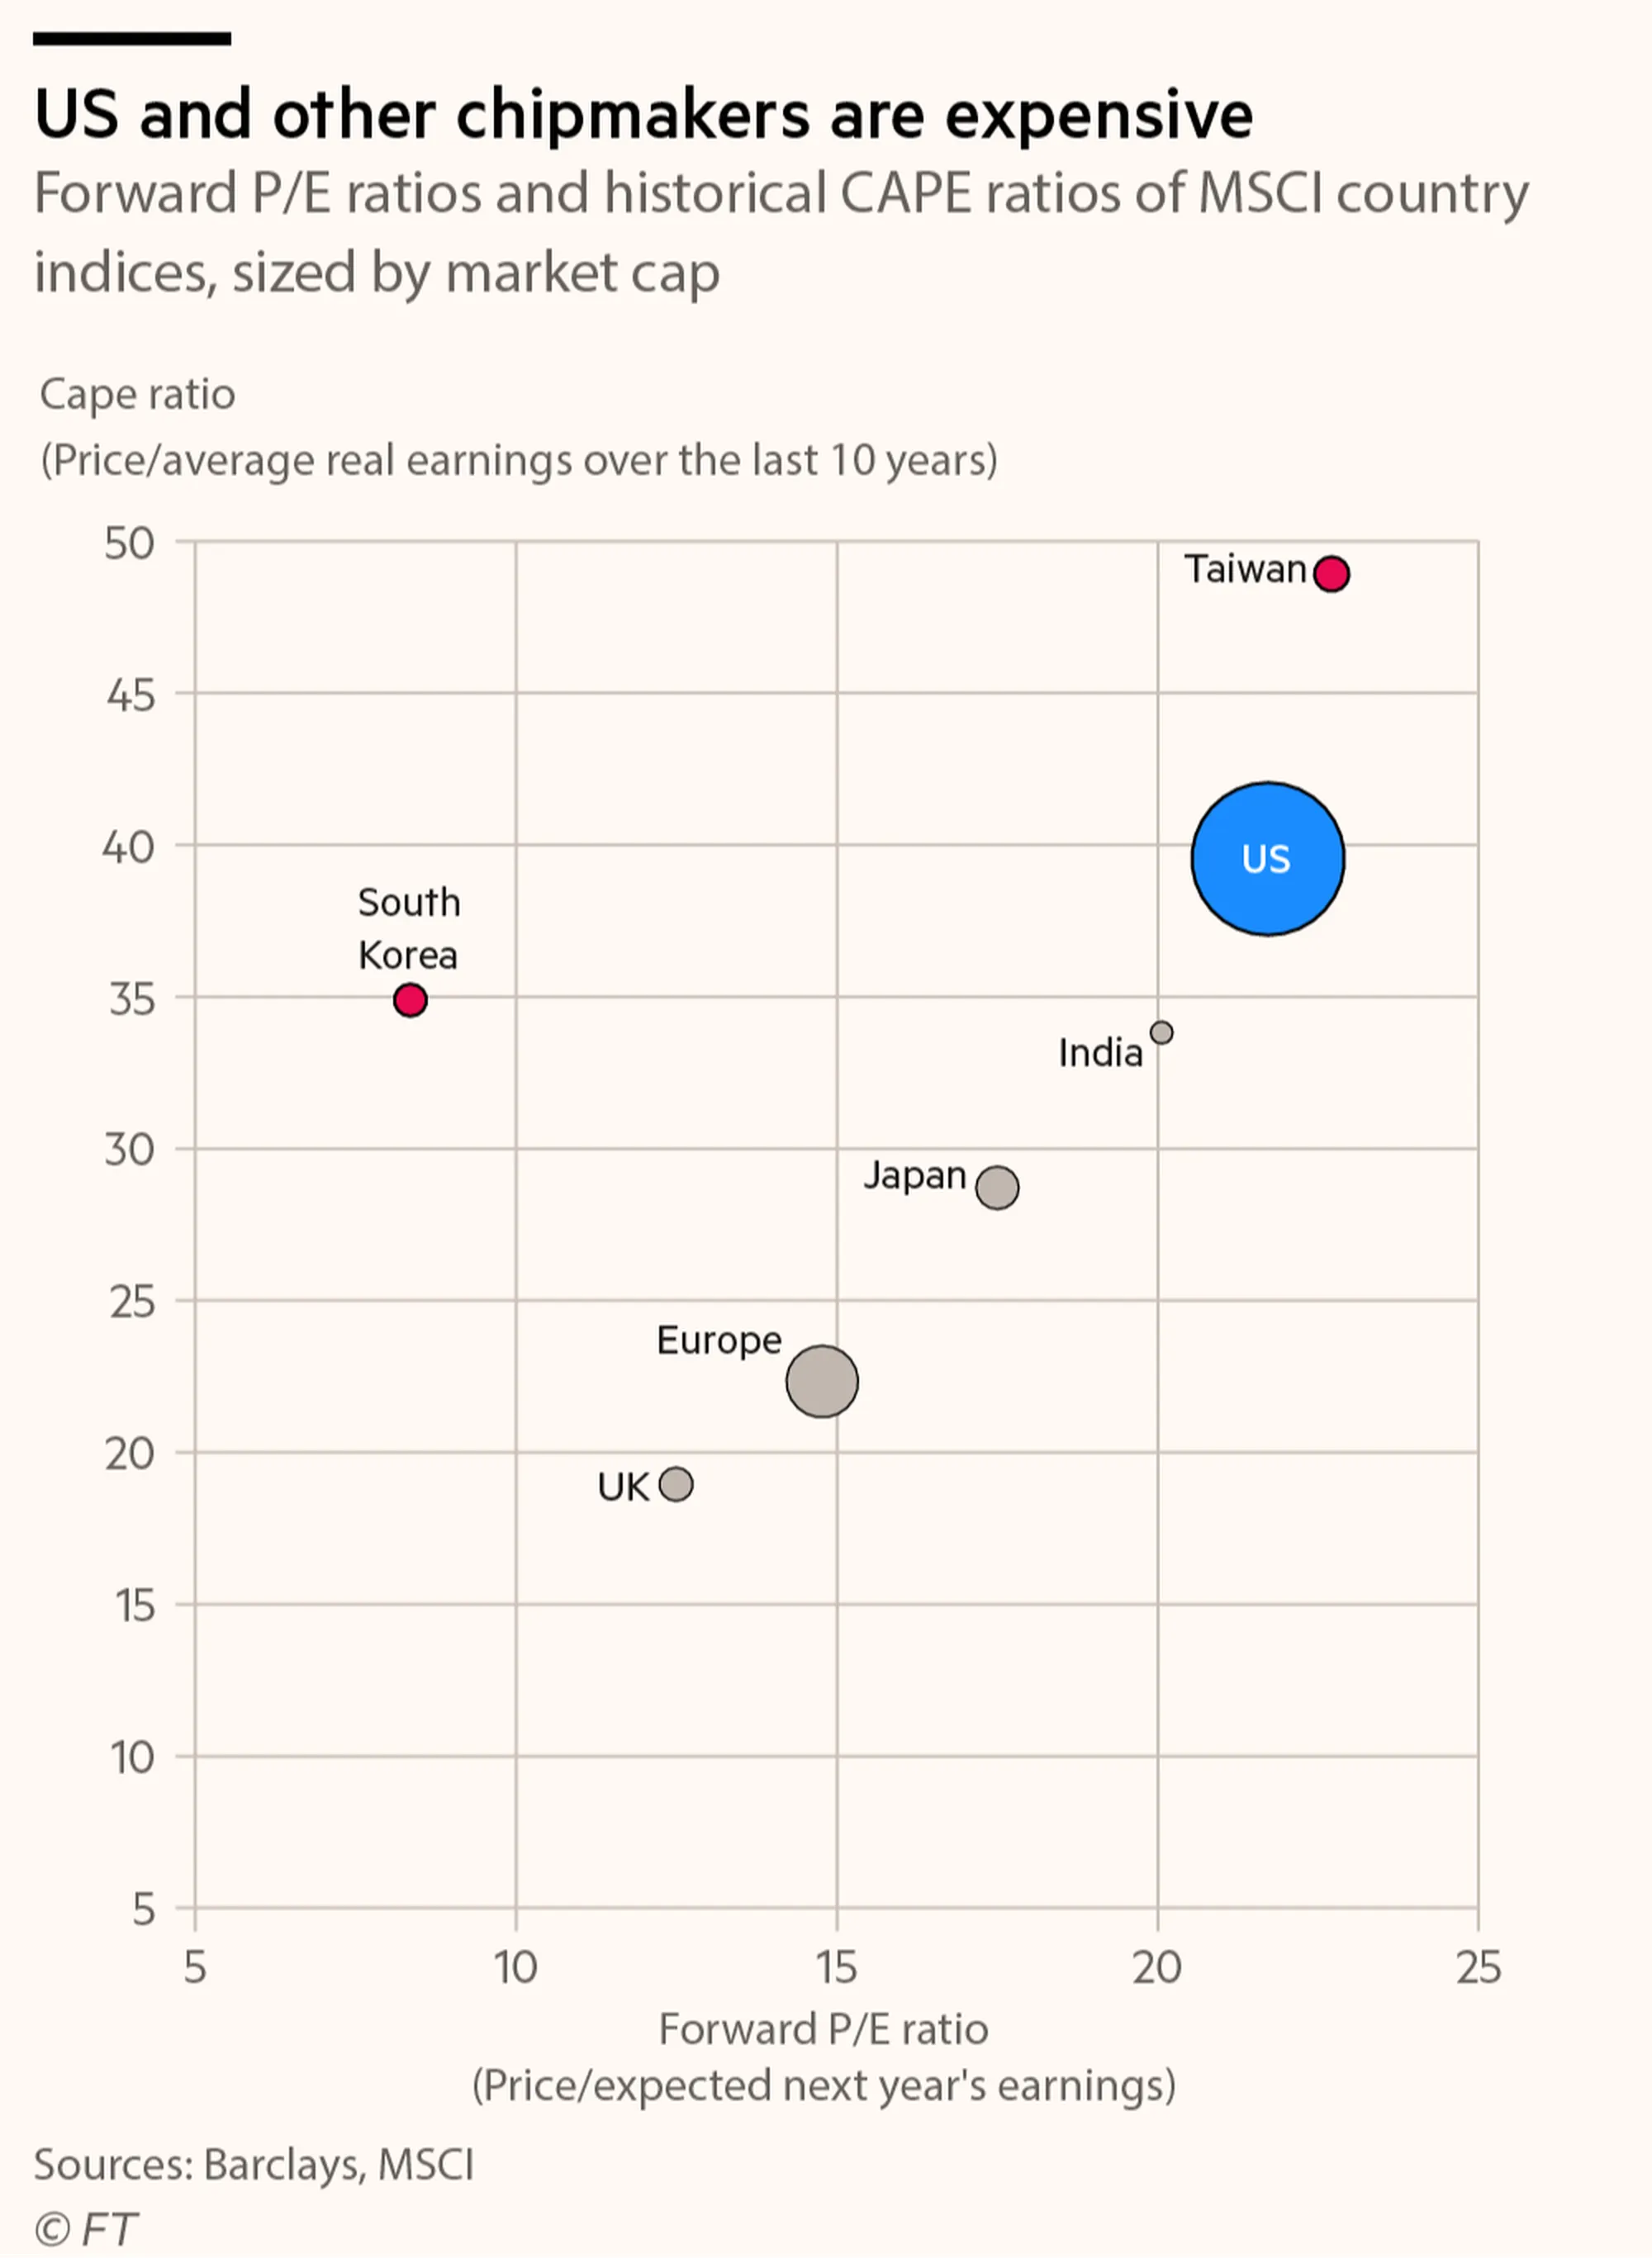
Good morning. This week we look at global market valuations, using both forward price/earnings ratios (which use estimates for the coming year’s earnings in the denominator) and cyclically adjusted price/earnings (“Cape”) ratios (which use 10-year historical average earnings in the denominator). On both forward and historical measures, the tech- and AI-heavy US and Taiwan markets look expensive relative to most other major areas. In contrast, the UK and Europe look cheap.
您已阅读30%(652字),剩余70%(1518字)包含更多重要信息,订阅以继续探索完整内容,并享受更多专属服务。